
- Insulation
- Posted
Breaking the mould - part V
Over the last year, Joseph Little’s articles for Construct Ireland on the interstitial condensation risk associated with insulating single leaf walls have raised crucial questions at a time of unprecedented interest in retrofitting insulation. This fifth and final article in the series compares simulations of several internal insulation options on common wall types, with worrying conclusions.
Reality, simulated reality and clear guidance
In the last edition of Construct Ireland, Breaking the Mould part IV established the standard that should be used to evaluate thermal upgrades of single leaf walls, described steps to physically prepare the wall, explained some of the mechanisms that affect the likelihood of mould and gave criteria for judging the simulations outputs. The next step is to simulate a number of permutations of typical internal insulation systems using Wufi Pro under IS EN 15026.
The simulations you will see show a troubling amount of the internally-insulated, west-facing Dublin wall buildups simulated experiencing relative humidity levels above 80% – which is a commonly used benchmark to indicate likelihood of mould and therefore risk of failure – with some dramatically above. Industry members may say that this doesn’t accord with their experience and therefore that the simulations are faulted. While the simulations have been extensively checked by a number of people, they do indeed need further validation through additional simulation and in particular testing (including opening-up of walls).
However can we claim that the simulations presented here don’t agree with experience? How many Irish houses were internally-insulated to 0.27 W/m2K before the advent of the Home Energy Saving scheme? How many of these were solid brick houses? Not very many, this writer suggests. We have only recently gone down this path. While there are some dreadful cases of obvious, dramatic building failure in Irish houses subsequent to insulation being applied, mould growth behind an internally insulated wall is not obvious or dramatic, and the situation could take years till a poorly-prepared substrate and inappropriate specification could result in failure that we can recognise as such, unless the wall is opened-up beforehand.
It is hoped that this series of articles generates a debate and a research programme leading to a code of practice for refurbishment with clear, useful guidance as early as possible. Readers can make this more likely by writing to the Departments of Energy – in relation to the HES scheme – and Environment – in relation to guidance on construction and energy efficiency – to add their voices to this call.
Setting up a series of comparative simulations & key questions
Initially nine internal insulation systems were selected: for reasons of time and manageability this was cut down to five systems. Three of them are generic, featuring phenolic, cellulose, mineral wool and vapour control layers. Two of them are proprietary – Calsitherm and Pavadentro. The two proprietary systems were chosen because they were designed with a special focus on internal insulation, are unique in the Irish market and because they were the only ones for which the writer had full Wufi data. All the systems are presented in table 1. It should be understood that the term ‘system’ is used, other than the two named systems, in its non-proprietary sense.

Table 1: showing the insulation systems studied and the key values
The focus here is to assess objectively the appropriateness of various internal insulation systems under a range of conditions. Inappropriateness in this case relates to whether the application could result in (1) damage to the original wall or insulation materials, and (2) excessive inter-stitial condensation and mould growth. Three variants out of many were chosen for their possible effect on the appropriateness of the internal insulation systems.
A) The internal moisture load: normal, as in a bedroom, or high, as in a shower room.
B) The masonry substrate: rendered blockwork plastered or brickwork plastered.
C) The U-value of the completed wall: 0.45 or 0.27 W/m2K. In the case of Calsitherm however 0.60 and 0.45 W/m2K were judged more typical of performance usually sought.
The effect of location – in terms of exposure, strength of driving rain, humidity levels and altitude – and other wall substrates such as rubble wall and hollow block on appropriateness are obvious variants that are omitted from this study.
Read the full Breaking the mould series
Part 1 - Part 2 - Part 3 - Part 4 - Part 5
The key questions surrounding the three variants chosen are that:
a) It is clear that a shower room will have higher humidity levels than a bedroom but can this affect the middle of an internally insulated wall, and can the insulation type or a VCL prevent a condition that might otherwise be unhealthy?
b) We know that brick will absorb greater moisture from the atmosphere and driving rain than rendered block, but is this problematic? Should the presence of certain substrates rule-out certain internal insulation solutions, or should additional protective steps be taken?
c) Under the HES scheme a U-value of 0.27 W/m2K is a key target to achieve in order to qualify for grant aid when upgrading single leaf walls with either internal or external wall insulation. Is this appropriate? Does the location and amount of insulation affect the risk of interstitial condensation? Critically should the target U-values be changed to reduce risk of interstitial condensation and mould?
These are all heavy questions, particularly so when taxpayers’ money is helping to fund work in people’s homes, when the Sustainable Energy Authority of Ireland and utility companies are in control of the specification standard and want to hugely increase the amount of work done, and where health may be at risk.
Common conditions for setting-up the comparative simulations
The following are among the key inputs used:
- The notional building is located in Dublin facing west using design year weather files.
- Every simulation was started on 1 October and ran for either two or three years till the end of September. Bear this in mind looking at the six monthly blocks of time in the graphs.
- Rain load has been calculated according to Ashrae Standard 160P which takes account of wind velocity: exposure was set at medium, for a building less than 10m high under a pitched roof.
- The rain water absorption factor is left at the default 0.7, which means that 70% of driving rain is absorbed, the rest splashes off.
- To allow the closest comparison insulation thicknesses were adapted so that exact U-values were achieved, even if unrealistic insulation thicknesses resulted – such as thicknesses of 0.0575m.
- In almost all cases the data listed in Wufi’s library of materials was used without change for each component. The exceptions to this were the data for the concrete block and the bricks. The block data was supplied by Roadstone Wood while the brick data was assembled by adding the thermal conductivity and density listed in table A1 of TGD L? – as table 1 shows – to the data of real bricks tested by the Fraunhofer Institute.
The minimum data required to carry-out a hygrothermal simulation are its bulk density, porosity, specific heat capacity, thermal conductivity and its vapour diffusion resistance factor (μ-value). Typically the Fraunhofer Institute lists a far greater range of data in the Wufi materials library – as figure 1 shows – however a user-created material can be simulated quite closely when these five characteristics are known.

Figure 1: showing material data for lime plaster in Wufi Pro
Unfortunately it’s still uncommon for many UK and Irish manufacturers to list vapour diffusion resistance capacity values, or the comparable values of water vapour diffusion-equivalent air layer (Sd value) or vapour resistivity (MNs/gm), all of which are numerically-related.
These long-winded terms describe how vapour moves through materials. The result of this absence is that, for now, most products available here can’t be modelled sufficiently closely. We have therefore mostly used the data established (in most cases) from extensive physical tests carried out by the Fraunhofer Institute or partner institutes in four continents. It would be a great advance for the industry if this information were tested and included in data sheets. Then again, as soon as the relevant authorities in Ireland and the UK start insisting that data supplied for certification conforms with IS EN 15026, suppliers will have to test and publish the missing data.
The comparative simulations
Working with Building Life Consultancy the writer focused on the relative humidity levels u within the first millimetre of original 20mm thick wet-applied, internal plaster finish that faces the room. Figures 5 and 6 show the monitor position, highlighted in pink. The previous article makes clear why relative humidity and not moisture is the key focus. There were several reasons for focusing on what happens in that 1mm zone and not on the insulation itself.
They are:
- In previous studies we have found that the original plaster finish when retained behind the drylining buildup either reduces the moisture content in the insulation significantly or has little effect. The difference is mostly due to the presence or lack of an external render. It is therefore common to all the internal insulation buildups simulated. As can be seen some insulation systems have a fibrous insulation, some rigid, some have a vapour control layer, some an air cavity, but all cases studied here retain the original plaster finish.
- This plaster is at the beginning of the masonry substrate which the newly installed insulation will leave cooler than heretofore. It is thus the most likely place for significant portions of vapour to condense as moisture – in other words it’s the dew-point.
- Five out of the six criteria listed by Wufi Online to evaluate interstitial condensation – as this article shows – can apply to this layer of plaster.
- It is not proprietary: none of the insulation manufacturers specify it or claim ownership over it.
 monitor position in one of the block internal insulation systems")
Figure 5: showing % relative humidity (RH) monitor position in one of the block internal insulation systems

Figure 6: showing % RH monitor position in one of the brick internal insulation systems
Breaking the Mould IV gave a list of criteria for judging acceptability of an insulation strategy. The main criterion is that moisture should not accumulate: clearly a % RH vector that constantly rises is a sign of impending failure. The fourth criterion of that list is more complex to use. It stated ‘if it takes longer than the first six months of a simulation for % RH to drop below 80% at a critical point in the buildup the specification is likely inappropriate’. This criterion gives a conservative position, based on the likelihood of mould growth, but may be quite restrictive if (i) the original uninsulated wall has been carefully prepared following all the steps described in the previous article and even more so if (ii) the insulation itself is also mould-inhibiting or at least provides no nutrients for mould.
Lothar Moll of Pro Clima argues that in case (ii) the % RH at the dew-point can be frequently higher than 80%, as long as moisture levels are also acceptable and reduce sufficiently every summer. Of the internal insulation systems studied Calsitherm is highly alkaline with excellent mould-inhibiting characteristics, its high capillarity also means it wicks away moisture from the dew-point. Phenolic provides no nutrients for mould (though mould may still flourish on its surface), mineral wool may provide some level of nutrition for mould while cellulose and wood fibre are both timber-based so require the most conservative assessment, though some woodfibre products are engineered to remove the nutrients that moulds seek.
For case (i) above, a key element of the relaxation may be the adoption of 83% as the threshold relative humidity. This is because temperature at the dew-point will be lower than 12C for most of the year, at about 5.5 to 8.5C, as figure 17 of this article and figure 5 of the previous article in this series show. The same location will be warmer than this temperature for parts of the summer (due to solar radiation warming the wall’s external surfaces). However, as this would be for less than six months it may not be significant.
Perhaps the safest approach to judging the simulations is to say that:
A. When the wall hasn’t been prepared as advised in the last article criterion should be rigidly applied,
B. When it has been prepared as advised the rule may be used with some flexibility, and
C. When the insulation is also mould inhibiting higher relative humidity levels may be accepted for longer, as long as other relevant criteria are met.
Note that full preparation of the original wall as listed in the last article includes a surface impregnation to reduce rainwater penetration: this is only simulated in figure 17 with marked results. Therefore we should apply approach (A) above in judging all other cases of this particular set of simulations. As we will see, even the closest attention paid to micro issues such as insulation type and membranes is not enough if macro issues like driving rain, substrate type and U-value haven’t been dealt with.
Comparing the outputs
The titles to the figures below clarify which graph relates to which type of wall. In general the relative humidity (% RH) for the 1mm of plaster is shown on the left side for an internally-insulated rendered blockwork wall, in the middle for a poor quality historical brick and on the right for a better quality brick and mortar. Each graph shows time in six monthly blocks along the X-axis and % RH on the Y-axis. Colour is used consistently to represent the % RH for a particular U-value and internal moisture load.
The first to be reviewed is the cellulose internal insulation system which features cellulose fibre insulation blown into voids between studs through Intello and intelligent vapour control layer with a gypsum plasterboard finish. Applying Criterion (4) it can be seen in the left graph of figure 7 that the yellow line, representing % RH within the 1mm plaster of a wall insulated to meet 0.45 W/m2K and enclosing a ‘dry’ room, dips briefly below 80% RH at about ten months – slower than the ideal six months – but stays mostly above. While its general trajectory is downwards it spends too long above 80%: this simulation therefore fails approach (A). The other three vectors perform worse. If the outer wall had been impregnated it is likely that the yellow and possibly cyan vectors would have passed.
 rendered block, inhomogeneous brick #1 and brick #2")
Figure 7: Cellulose system – graphs showing % relative humidity in plaster abutting insulation – (left to right) rendered block, inhomogeneous brick #1 and brick #2
It is interesting to see that the lines are paired in accordance with their moisture load: where the internal insulation faces a wet-room – the blue and magenta lines – the trajectories follow the same upward path regardless of U-value. Criterion 6 of the previous article states that the moisture load of wood-based insulants should stay below 20% by volume. A quick check in the Wufi file for the wall insulated to 0.45 W/m2K enclosing a ‘dry’ room shows that the insulation stays below 20% at all times but moisture levels are too high in the three other cases.
The reader may notice that the yellow line, representing the lowest U-value and driest internal conditions has the greatest daily and seasonal oscillations. This is because this variant also has the best ability to dry out. The u relatively dry fibrous insulation beside the plaster can absorb and release moisture while the insulation and Intello membrane allow good back diffusion in summer, as described in Breaking the Mould part I. However as moisture levels at the dew-point grow – see the blue and magenta vectors – the ability to dry-out is compromised and oscillations reduce.
The middle graph has a result that can only be described as shocking. The brick surface must be allowing a large percentage of the driving rain that hits it to quickly alter the moisture content of the whole wall. An inspection of the Wufi material file reveals that it is ‘historic and inhomogeneous’. This real brick, measured by the Fraunhofer Institute, is likely to have fissures, uneven firing and so on. Whereas no insulation, a roaring fire and a high level of infiltration would have allowed a large amount of moisture – resulting from driving rain – to evaporate and dry during the building’s early life, the internal insulation now seems to slow or block this. As can be seen in figure 1 above the moisture content of lime plaster which reaches 99% RH is 180 kg/m3. This quantity of vapour and humidity can’t be good for the brick itself. However at this % RH mould is inevitable in the plaster, the insulation system will fail and sadly the homeowners will regret the day they ever got work done to this particular wall.
Nobody wants to see results like that. Realising that this brick is probably uncharacteristic of most bricks used in Ireland the team selected what was judged to be a more representative, homogenous and weather-resistant brick. It is striking though that the change in brick was the only change made in simulating the right-most graph: substrate is clearly emerging as a hugely significant issue. In this last group of simulations the plaster begins to dry-out during the first six months – from 1 October to 1 April – in all cases, but a strong reversal happens after that which causes all four vectors in that graph to fail. We will explore the cause of this striking change later.
The Pavadentro internal insulation system features woodfibre insulation boards 'mushroom head' fixed against the substrate without battens or studs. It has a wet-applied lime plaster finish. It is shown in figure 8. Pavadentro is very clever in that it has a functional layer – so named by its manufacturers – about three-quarter way towards the dew-point which forces vapour being driven through the buildup wall to condense as temperature at that point has already dropped but it is not yet at the dew-point temperature. As this layer is within the insulation it allows moisture and vapour to dissipate more easily, some back to the room.
 rendered block, inhomogeneous brick #1 and brick #2")
Figure 8: Pavadentro system – graphs showing % Relative Humidity in plaster abutting insulation – (left to right) rendered block, inhomogeneous brick #1 and brick #2
As can be seen in the left graph in figure 8, this system performs better under the simulated conditions than the system before, however using approach (A) everything still fails. This time when Wufi is checked for moisture (criterion 6) all four insulation systems pass. It is likely that if we could just reduce the driving rain this system would perform very well. Looking at the other two graphs it can be seen that all variants of the two sets of brick wall simulations continue to fail though some characteristic of the wood fibre insulation buildup, possibly the density or so-called functional layer, is making it slightly less dramatic than heretofore.
The phenolic and airspace internal insulation system (figure 9) studied features insulation mechanically fixed to timber or metal studs with a plasterboard finish. The plasterboard is often supplied bonded to the insulation which makes the installation of a continuous vapour control layer in the ideal position difficult.4 Table 1 shows the water vapour diffusion resistance factor of the phenolic insulation the Fraunhofer Institute tested (30 μ-value or 150 MNs/gm) as being roughly nine and twenty times greater than Pavadentro and cellulose respectively. All simulated versions of this system simulated also fail.
 rendered block, inhomogeneous brick #1 and brick #2")
Figure 9: phenolic system with airspace – graphs showing % RH in plaster abutting insulation – (left to right) rendered block, inhomogeneous brick #1 and brick #2
It is interesting to note that:
- The short-term oscillations in the (fibrous) Pavadentro vectors are less than those of (fibrous) cellulose but greater than those of the airspace and (rigid) phenolic system: these differences broadly reflect the ratio in vapour resistivity values, and
- The fibrous, denser and more vapour permeable insulations are better at dealing with higher internal moisture loads.
Despite the different chemical and physical makeup of these three insulations the overall pattern of increase in % RH is strikingly similar. Macro issues such as driving rain, internal moisture load and the level of insulation are clearly having a greater impact than micro issues such as insulation type and the presence or absence of air spaces and membranes.
The Calsitherm internal insulation system (figure 10) is designed for the specialist conservation market. It features mould-resistant, calcium-silicate insulation boards bonded to a lime-plastered substrate, with a wet-applied lime plaster finish. Partly because the boards are more similar to the masonry materials in density and material and partly because the boards are designed to have high capillarity – where moisture is literally sucked through capillaries, or narrow tubes – the Calsitherm system performs best of all systems examined in these simulations. Nonetheless there are failures.
 rendered block, inhomogeneous brick #1 and brick #2")
Figure 10: Calsitherm system – graphs showing % RH in plaster abutting insulation – (left to right) rendered block, inhomogeneous brick #1 and brick #2
In the left graph within figure 10, the 0.6 and 0.45 W/m2K variants with normal moisture load just pass criterion (4), but the versions with high moisture load don’t. Bearing in mind Lothar Moll’s comments 0.27 W/m2K should also be acceptable. The extraordinary capillary action of this insulation is somewhat in evidence with the rendered block wall but it’s very evident in the two brickwork versions. u While there are unacceptable % RH levels and an upward trajectory showing in both it is clear that the Calsitherm is literally pulling moisture out of the drenched brick substrate every summer. If the driving rain ingress could be reduced this system would surely work very well.
The mineral wool internal insulation system in figure 11 features insulation friction-fixed between studs or pinned in place by clips and rails, with an Intello VCL and a plasterboard finish. The graphs here are very similar to cellulose though it absorbs and releases less than cellulose resulting in smaller short-term oscillations. To add to a later discussion 0.6 W/m2K (in green) has also been simulated for the rendered blockwork wall. The green vector is just about acceptable as it drops below 80% RH in about nine months but spends about 7-8 months of the year below the line thereafter. The other lines fail as before.
 rendered block, inhomogeneous brick #1 and brick #2")
Figure 11: Mineral wool system – graphs showing % RH in plaster abutting insulation – (left to right) rendered block, inhomogeneous brick #1 and brick #2
Studying the % RH in plaster at the dew-point appears to be a powerful litmus test of the suitability for an internally-insulated system on a particular wall under particular conditions. It is clear, despite real differences in the makeup and thermal and vapour characteristics of those systems, that unless proper account is taken of the macro issues as described above, an insulation system, regardless of how good it is, can fail. Undoubtedly further simulation and careful physical testing and measuring are needed to confirm and clarify these issues further.
A reader may be left feeling that it is better to do nothing than to internally insulate: that would be a poor lesson to take from this work. If time had allowed all of these simulations would have been carried out again – this time featuring a good external surface impregnation. This writer suggests the results would be strikingly different. Independent corroboration on the importance of dealing with the macro issues first has recently been unearthed in a book published in 2005 by the home of super-insulation strategies: the Passivhaus Institute in Darmstadt. The book’s title, translated from German, is Factor 4 for Vulnerable Old Buildings – Passive House Components & Internal Insulation. In one section the author writes that when driving rain and rising damp are dealt with “then – and only then – is interior insulation better than no insulation.”
Attempts at improving the results
There must be ways of safely specifying higher levels of insulation for blockwork walls and at least some level of internal insulation work for solid brick walls. To explore these questions one system, the mineral wool system, was selected for further simulation.
Looking at the rendered blockwork substrate the first step was to reduce the internal moisture load. The second step was to try to reduce the external moisture load by increasing the 20mm sand-cement render to 35mm thick: this is after all a traditional thickness and may reduce driving rain ingress further. See figure 12 below. Using a foil vapour barrier (μ-value of 1.5 million) in lieu of the Intello VCL totally blocks any movement of vapour or moisture into the wall from inside. The result not surprisingly is that the vectors for higher internal moisture loads disappear behind those of lower internal moisture loads. The ability of the insulation to dry-out to the room is blocked however, so the yellow and cyan vectors lose the healthy downward direction evident in the left graph of figure 11 and slowly start to rise. The foil barrier is not a good long term solution. The second graph is also disappointing. The extra 15mm of render has resulted in only a very modest improvement.
 foil in lieu of Intello VCL, and 35mm thick external render")
Figure 12: Variations on mineral wool system for rendered block – graph showing % RH in plaster abutting insulation – (left to right) foil in lieu of Intello VCL, and 35mm thick external render
The next move is to carry-out the equivalent changes to the ‘good’ brick wall (figure 13). The foil vapour barrier has a similar effect. In this case drying-out is irrelevant as the brick is literally drenched and the ‘tap’ of driving rain has not been turned-off. However the second step for brick shows a remarkable change. A silane impregnation has been simulated, in this case by changing the moisture ingress due to driving rain from the usual 70% to 10%. This percentage was used under advice from the technical advisor of a system available in Ireland. Suddenly all four vectors move in a strong downward direction. 0.45 W/m2K performs excellently, 0.27 is marginally acceptable – though better than in any block wall studied – and the other two just fail.
 foil in lieu of Intello VCL, and rainwater absorption reduced from 70% to 10%")
Figure 13: Variations on mineral wool system for brick #2 – graph showing % RH in plaster abutting insulation – (left to right) foil in lieu of Intello VCL, and rainwater absorption reducedfrom 70% to 10%
This improvement is clear evidence of the marked negative impact that driving rain has on the internally-insulated buildup of both rendered solid block and brick walls.
Given the impact of impregnating the outside it is suggested that the same approach be taken with the rendered block wall. On the reasonable assumption that this would perform better we could then say that internally insulating a block or brick wall to a U-value of 0.45 W/m2K when the wall has been fully prepared appears to be a sensible, robust specification, but better U-values – or failure to deal with the other macro issues – increases the risk of failure.
Success begs the question of the other obvious approach to insulating brick while reducing driving rain impact: externally insulating with clay brick slips or a brick-effect render to clad it.
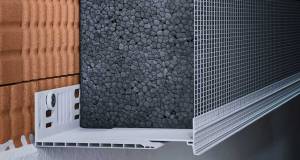
Ibstock Bricks are bringing their version of the former to the market this spring – with mineral wool insulation – and Redmond Acrylic have already installed examples of the latter in several places in County Dublin with expanded polystyrene, in what may well be Ireland’s first privately-owned terrace of externally insulated houses. For the next simulation Diffutherm, a woodfibre-based external wall insulation system, was chosen, as figures 14 and 15 show. It was recently awarded a British Board of u Agrément certificate.

Figure 14: showing % RH monitor positions for a woodfibre external wall insulation system mounted onto brick #2
 % RH at inner 1mm of EWI, and at rear of internal plaster")
Figure 15: external wall insulation on brick – (left to right) % RH at inner 1mm of EWI, and at rear of internal plaster
The Diffutherm external wall insulation system has an 8mm thick finish of mineral render and mesh mounted directly onto the substrate: in this case brick #2. As the 1mm of plaster selected before now faces the room it is pointless to simulate % RH in it, as it would be almost identical to room values. This monitor is therefore moved to face the brick. A new monitor is located within the innermost 1mm of insulation too. In this way it can be assessed whether moisture is accumulating in the insulation or brick under the influence of internal moisture load and driving rain.
In the right graph of figure 15 % RH reflects the level of internal moisture load more than it does the insulation value, which is to be expected, though it is interesting to see that the 0.27 W/m2K vectors result in slightly lower % RH this time. This is because more external insulation now keeps the brick substrate warmer thus reducing the volume of vapour condensing as moisture when air currents brush against the internal wall surface. The left graph in figure 15 is even more impressive than the right graph of figure 13: note the scale difference on the Y-axis. Now we see % RH plummet from the starting position of 80% to about 55% RH – in other words, room conditions – despite being on the external side of the brick wall substrate. Another interesting change is that the oscillations of the yellow and blue vectors – representing 0.45 W/m2K – are more violent than the cyan and pink which represent 0.27 W/m2K. This is because higher levels of insulation isolate the monitor more from external climate conditions making conditions at the monitor and the brick behind it more and more healthy and stable.
It seems reasonable to deduce from this that – once driving rain is dealt with – internally-insulated walls appear to work best with less insulation than 0.45 W/m2K but externally-insulated walls work best with far more. Moving to 0.27 W/m2K internally appears to require careful management of all the macro issues and ideally use of specialist insulants. But is it worth all that trouble when the alternative is a good external insulation system properly applied with lower thermal bridging, less impact on the occupants, no loss of floor area, an ability to safely insulate to a higher level, and when all is said and done arguably less cost?
Conclusions
Everyone wants to reduce energy demand by insulating as highly as possible, but insulation without due regard to structure or health, or without full understanding of the changes the act of insulating creates, can only cause problems.
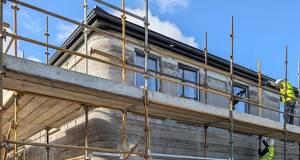
 where three householders externally insulated with a brick-like render finish (above) to base and a napp finish render")
A terrace in North Dublin (below) where three householders externally insulated with a brick-like render finish (above) to base and a napp finish render
 where three householders externally insulated with a brick-like render finish (above) to base and a napp finish render")
Given the volume of refurbishment work expected to commence it is hoped that government bodies, the utilities now entering the refurbishment market under the EDRT,
and professional institutes will quickly engage with these concerns and contribute to the creation of a detailed, practical code of practice for refurbishment of dwellings. A key initial step is a general acceptance that current guidance on refurbishment is inadequate.
Testing of, for instance, three competing impregnation treatments and a range of typical Irish blocks, bricks, renders, plasters and insulants by an independent third party is needed to form a basis for all simulations and assessment of Irish construction.
With use of new test data the simulations u presented in this article would then need to be revised and significantly expanded on as a way to explore the most appropriate, healthy ways to carry-out energy-efficient refurbishments.
One striking conclusion of this comparative series of simulations is that higher and higher levels of external insulation appear to create healthy and ever more stable conditions within the wall buildup, while even relatively modest levels of internal insulation face tougher conditions and either fail or are bordering on failing. An equally significant conclusion is that the right treatment of the external face appears to allow the installation of internal insulation without risk of growth in internal moisture levels.
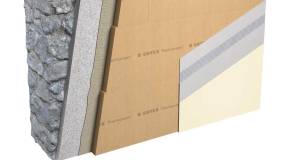
 Ibstock’s Brickshield system, with Rockwool high density external insulation coated in the company’s adhesive mortar, before Ibstock brick slips are applied")
(below and above) Ibstock’s Brickshield system, with Rockwool high density external insulation coated in the company’s adhesive mortar, before Ibstock brick slips are applied
 Ibstock’s Brickshield system, with Rockwool high density external insulation coated in the company’s adhesive mortar, before Ibstock brick slips are applied")
Organisations need to be prepared to revise old guidance based on the new results. It is suggested that the SEAI re-examines the insulation performance associated with the internal insulation grant. This work is clearly not conclusive but it is worthy of serious consideration: simulated walls internally-insulated to 0.27 W/m2K clearly failed in more than 35 simulations.
Special thanks to Doctors Mike Lawrence of the University of Bath and Lothar Moll of Pro Clima GmbH for their careful review and critique of this article and the simulations it’s based on. Thanks also to engineers Niall Crosson of Ecological Building Systems and Christoph Zürcher of Natural Building Technology for their inputs. Finally thanks to Philip Thompson of Roadstone Wood for data on Irish concrete blocks.
Bibliography
BS 5250 (2002) - Code of practice for control of condensation in buildings
EN IS0 13788 (2001) - Hygrothermal performance of building components and building elements - Internal surface temperature to avoid critical surface humidity and interstitial condensation - Calculation methods
EN ISO 15026 (2007) – Hygrothermal performance of building components and building elements — Assessment of moisture transfer by numerical simulation
Feist, W., (2005) - ‘Factor 4 for Vulnerable Old Buildings – Passive House Components & Internal Insulation’ Passivhaus Institute, Darmstadt, Germany
Künzel, H.M., Kieszl, K. (1996) - ‘Drying of Walls after Impregnation’, Franuhofer IBP
Read the full Breaking the mould series
Part 1 - Part 2 - Part 3 - Part 4 - Part 5
- Articles
- insulation
- Breaking the mould part V
- thermal upgrade
- single leaf
- calsitherm
- moisture load
- substrate
- blockwork
- Diffutherm
Related items
-
 New Ejot profile cuts thermal bridging losses by 25mm insulation equivalent
 -
 Ireland’s first 3D printed homes insulated with clay foam
 -
 Unilin Ireland launches embodied carbon report
 -
 Ecological launches Retro EcoWall for internal wall insulation
 -
 Xtratherm name changes to Unilin
 -
 Ecological Building Systems launch Retro EcoWall for internal wall insulation
 -
 Kore launches low carbon EPS
 -
 Kilsaran gets NSAI cert for EWI to steel frame
 -
 Steico offering free wood fibre insulation samples
 -
 Top 5 questions about specifying structural thermal breaks
 -
 Major new grants for retrofit & insulation announced
 -
 How will we decarbonise heating?