

- NZEBs
- Posted
NZEB’s effect on new home specs emerges
This article was originally published in issue 36 of Passive House Plus magazine. Want immediate access to all back issues and exclusive extra content? Click here to subscribe for as little as €20, or click here to receive the next issue free of charge
Early signs have emerged of how the construction industry is meeting the NZEB standard for new homes – with heat pumps becoming near ubiquitous, mechanical ventilation systems starting to dominate, and fabric standards improving.
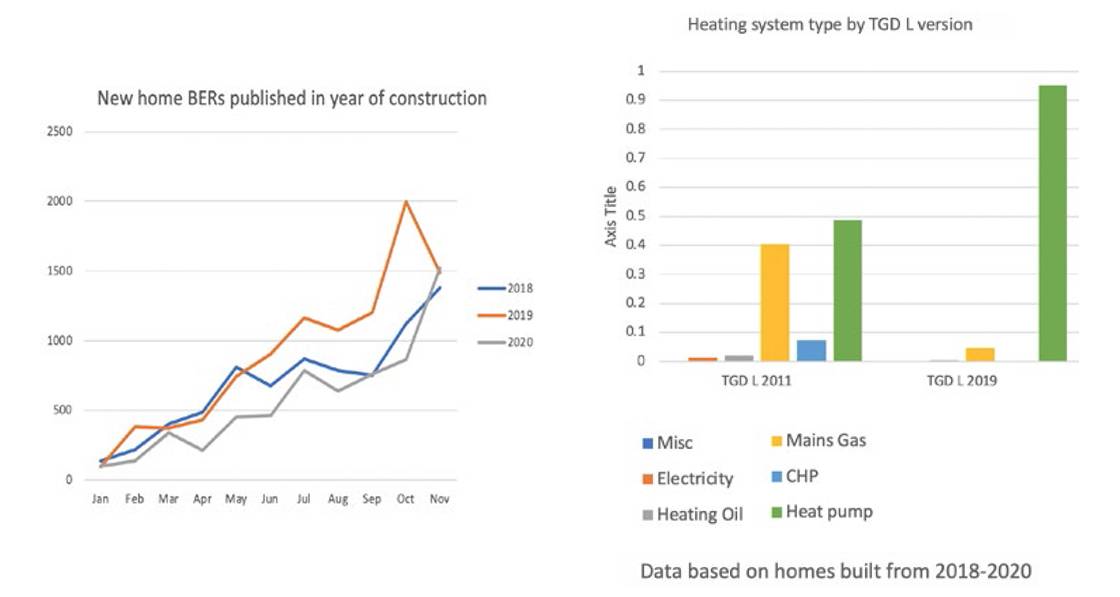
Analysis by Passive House Plus of data from the National BER Research Tool showed that 1,862 final BERs for new homes were built to Technical Guidance Document L 2019 for the year up to 8 December. The analysis compared new homes built to the 2019 version of TGD L against new homes built between 2018-2020 to the previous (2011) version of TGD L.
Transitional arrangements in TGD L mean that some homes built to the 2011 requirements are still being completed.
In total, 91.8 per cent of TGD L 2019 homes are A2 rated, 6.7 per cent are A3s, and 1.2 per cent are A1s. The average primary energy score is 41 kWh/m2/yr, compared to an average of 51.3 kWh/m2/yr for new homes built to the previous regulations.
The most significant change in specifications in the shift from 2011 to 2019 TGD L may lie in the space heating systems – 95.1 per cent of new homes built so far to 2019 TGD L feature heat pumps, almost doubling their market share from 48.7 per cent of the 2011 TGD L homes analysed. The main loser is gas boilers at 4.6 per cent (-35.9 per cent), with oil at 0.3 per cent (-1.7 per cent), CHP at 0 per cent (-7.4 per cent) and direct electric at 0.1 per cent (-1.2 per cent).
Another major shift is evident in ventilation systems, though 8 per cent of the dataset in this area and on airtightness tests is missing due to temporary issues with the National BER Research Tool which SEAI plans to resolve. Whole house extract ventilation systems – the category in DEAP which applies to mechanical extract ventilation with or without demand control – indicatively has 55.4 per cent of the market (+25.7 per cent), natural ventilation has 17.5 per cent (-27.8 per cent) and heat recovery ventilation has 17.4 per cent (-5.2 per cent).
Compliance issues
Alarmingly, 25.5 per cent of naturally ventilated homes built to 2019 TGD L have a q50 result of less than 3 m3/hr/m2 at 50 Pa. In apparent recognition that natural ventilation is not fit for purpose for airtight homes, TGD F 2019 (ventilation) does not include guidance for natural ventilation below a q50 score of 3.
Overall, 85.7 per cent of homes built to 2019 TGD L which failed to comply with the requirement to conduct an airtightness test were naturally ventilated – suggesting that developers who persist in the use of natural ventilation may be more likely to fail to comply with other aspects of building regulations.
The naturally ventilated homes also had the highest primary energy score – an average of 46.3 kWh/m2/yr, compared to 40.7 and 35.9 kWh/m2/yr for homes with whole house extract ventilation and heat recovery ventilation systems respectively.
Average U-values for roof and floor are unchanged from the average for 2011 TGD L homes at 0.12 W/m2K, with walls improving from 0.18 for 2011 TGD L to 0.17 for 2019 TGD L. Meanwhile average window U-values improved from 1.21 to 1.17, and doors made a bigger leap, from 1.33 to 1.22.
In terms of thermal bridging, 69.3 per cent of new homes used a Y-value of 0.08, compared to 68.8 per cent of 2011 TGD L homes, while 24.1 per cent (+2.5 per cent) used a value of 0.15, and 6.4 per cent (-3 per cent) used a figure of less than 0.08.
The average airtightness test result of homes built to the 2019 regs is a q50 of 2.55 m3/hr/ m2 at 50 Pa, compared to an average for the 2011 TGD L homes of 2.81 – excluding homes which were not tested, where a default value of 7.0 was used. Over 5 per cent of TGD L 2019 homes failed to comply with the airtightness requirements, including 4.1 per cent where no airtightness test was done, and 1.3 per cent which had a q50 of more than the new backstop of 5.
The data also shows the effect that the Covid-19 pandemic has had on housing completions. BERs were published for 6,267 new homes in the first 11 months of this year, where the year of construction was stated as 2020, compared to 9,842 for the same period last year. It’s unclear whether a surge in BERs in November are signs of completions recovering to previous levels.
In total, 11,096 BERs were published in 2019 for homes built that year, but the standing total has since grown to 16,986 homes, due to the lag of BERs published after the year of construction. The true total number of builds for 2019 is likely between 20-21,000 new homes, with the lower number of BERs due to non-compliance among self-builders with the legal requirement to obtain BERs prior to occupying the home. The SEAI data for 2019 includes 1,367 detached homes where the BER was obtained for occupation by homeowner, which indicates that this cohort are self-builders. Data on commencement notices from the Building Control Management System suggests that the true total number of self builds may be circa 4,000 new homes per annum.
Related items
-
 EU Electrification Action Plan to accelerate heat pump transition
 -
 Housing minister calls for faster retrofit to shield homes from energy shocks
 -
 Planning reform will thwart low energy housing, councils say
 -
 Cairn secures passive house certification for three Dublin developments
 -
 UK net zero carbon standard accepts passive house as compliance route
 -
 Women make up just 11 per cent of Ireland's construction workforce, says CIF